I found out something alarming recently. I was already aware that different wireless devices had different ‘Receiver Sensitivity‘, but I wrongly assumed that devices of the same model would have the same sensitivity. For example, I assumed that all Proxim Orinoco 8494 adapters, probably the most popular WiFi test adapter for WLAN professionals, would have the same sensitivity because they are the same product, with the same components, made the same way, by the same manufacturer.
It turns out I was wrong!

So what?
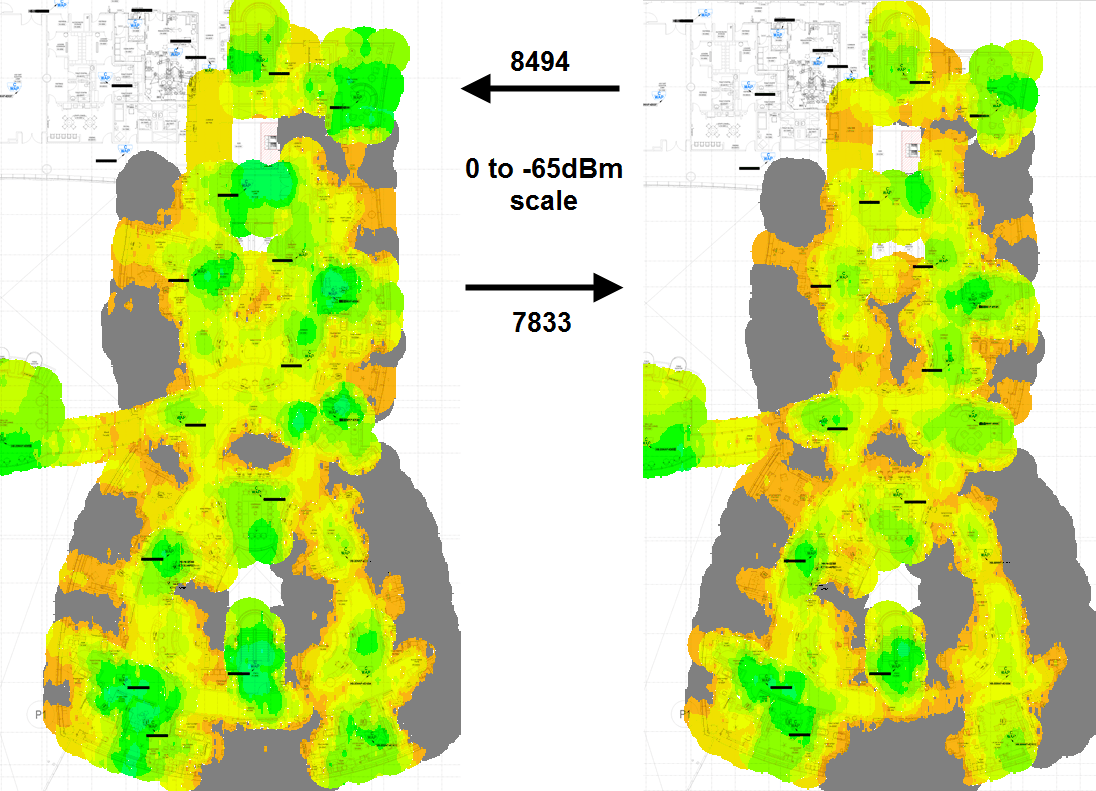
Well, when we are doing wireless surveys we are probably using third party adapters, just like the 8494’s, to mimic the devices/clients we are actually surveying for, because the clients themselves rarely provide the detailed RF statistics we need. If your 8494’s are “hearing” things 5dB better than your client which needs -65dBm, then your heat maps need to show where signal drops below -60dbm (-65 + 5 = -60).
In another blog post I’m putting together where I compare heat maps from AirMagnet and Ekahau I also take the opportunity to compare the new Netscout AM/D1080 adapter (OEM Edimax EW-7833UAC) with the long favoured Proxim 8494 adapter. Upon reviewing the results however it was clear that the Edimax adapter has a different Receiver Sensitivity to the Proxim, as the heat maps looked significantly different at the same signal scale.
So to provide an accurate comparison it was clear I was going to have to measure the sensitivity of the adapters so I can adjust the signal scale so I am comparing Apples to Apples. And anyone who is performing 802.11 surveying should be doing the same. You need to know how the adapters in your toolbox compare to the most demanding client that you are surveying for to ensure your presenting the correct data to your customer/management. Hopefully this post will provide a guide as to how you measure the sensitivity of your adapters. After some advice from the awesome people on the Wi-Fi Pros Slack channel I decided to conduct the test in the garden where I had plenty of space with no obstructions between my signal source and the receiving adapters. Originally I had intended to test the adapters on my desk about 1-2 meters from my home AP. But Joel Crane and Keith Parsons pointed out, as this excellent post from Nigel Bowden explains, that the results are far more consistent and reliable if you get a decent distance (4m+) between the source and recipient. I won’t cover this ground again, read Nigel’s post. So this was the setup for my test:
- Signal Source: TP Link TL-WR702N
- Survey Laptop: Fujitsu T902 Windows 10
- Survey Software: AirMagnet Survey Pro 9.2 Build 36843
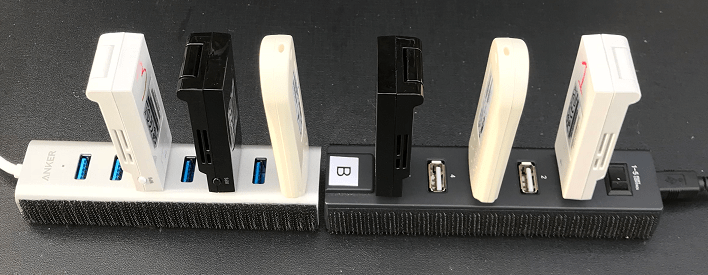
- Hub1: Rosewill RHB330 7 Port USB2.0
- Hub2: Anker A7513 7 Port USB3.0
- 2x Proxim Orinoco 8494’s
- 2x Edimax EW-7833UAC
- 1x Omnipeek Wildpacket 11n (OEM Edimax EW-7733UND)
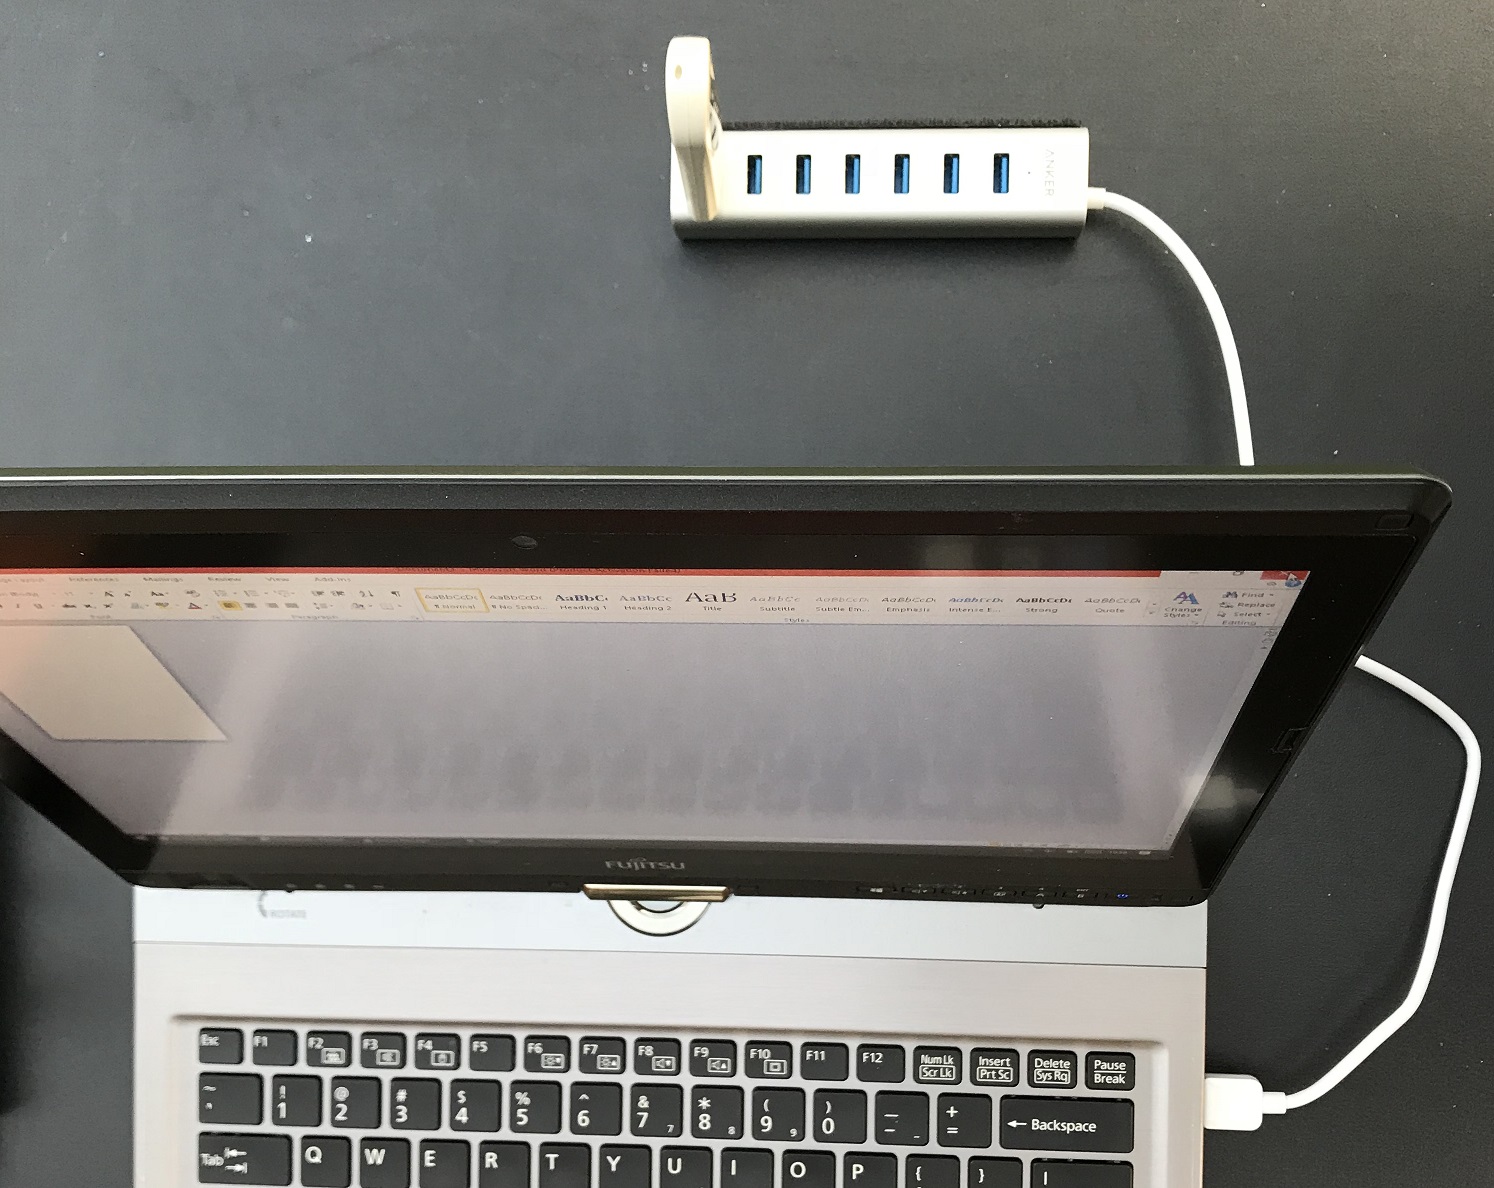
The AP was placed 5.4m away across my garden (backyard for the Americans reading this!). Sorry for the mess, the leaves had just started to fall…
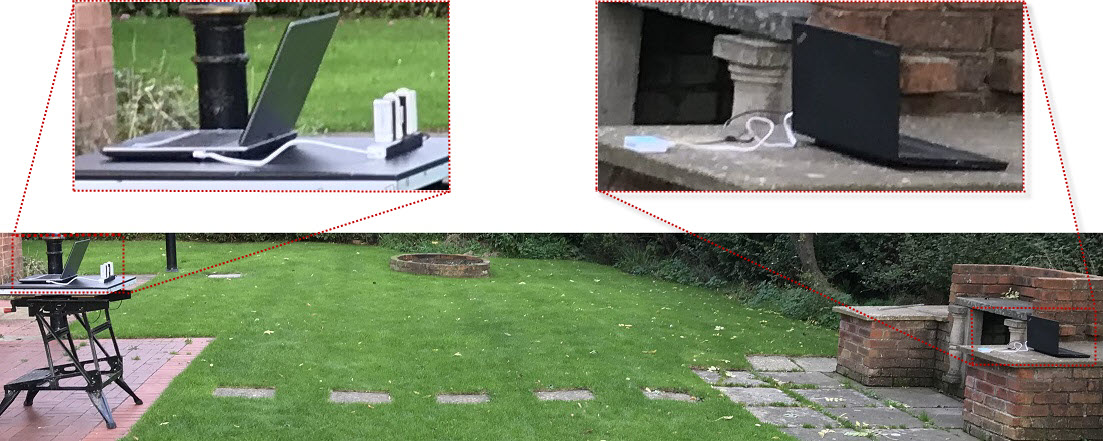
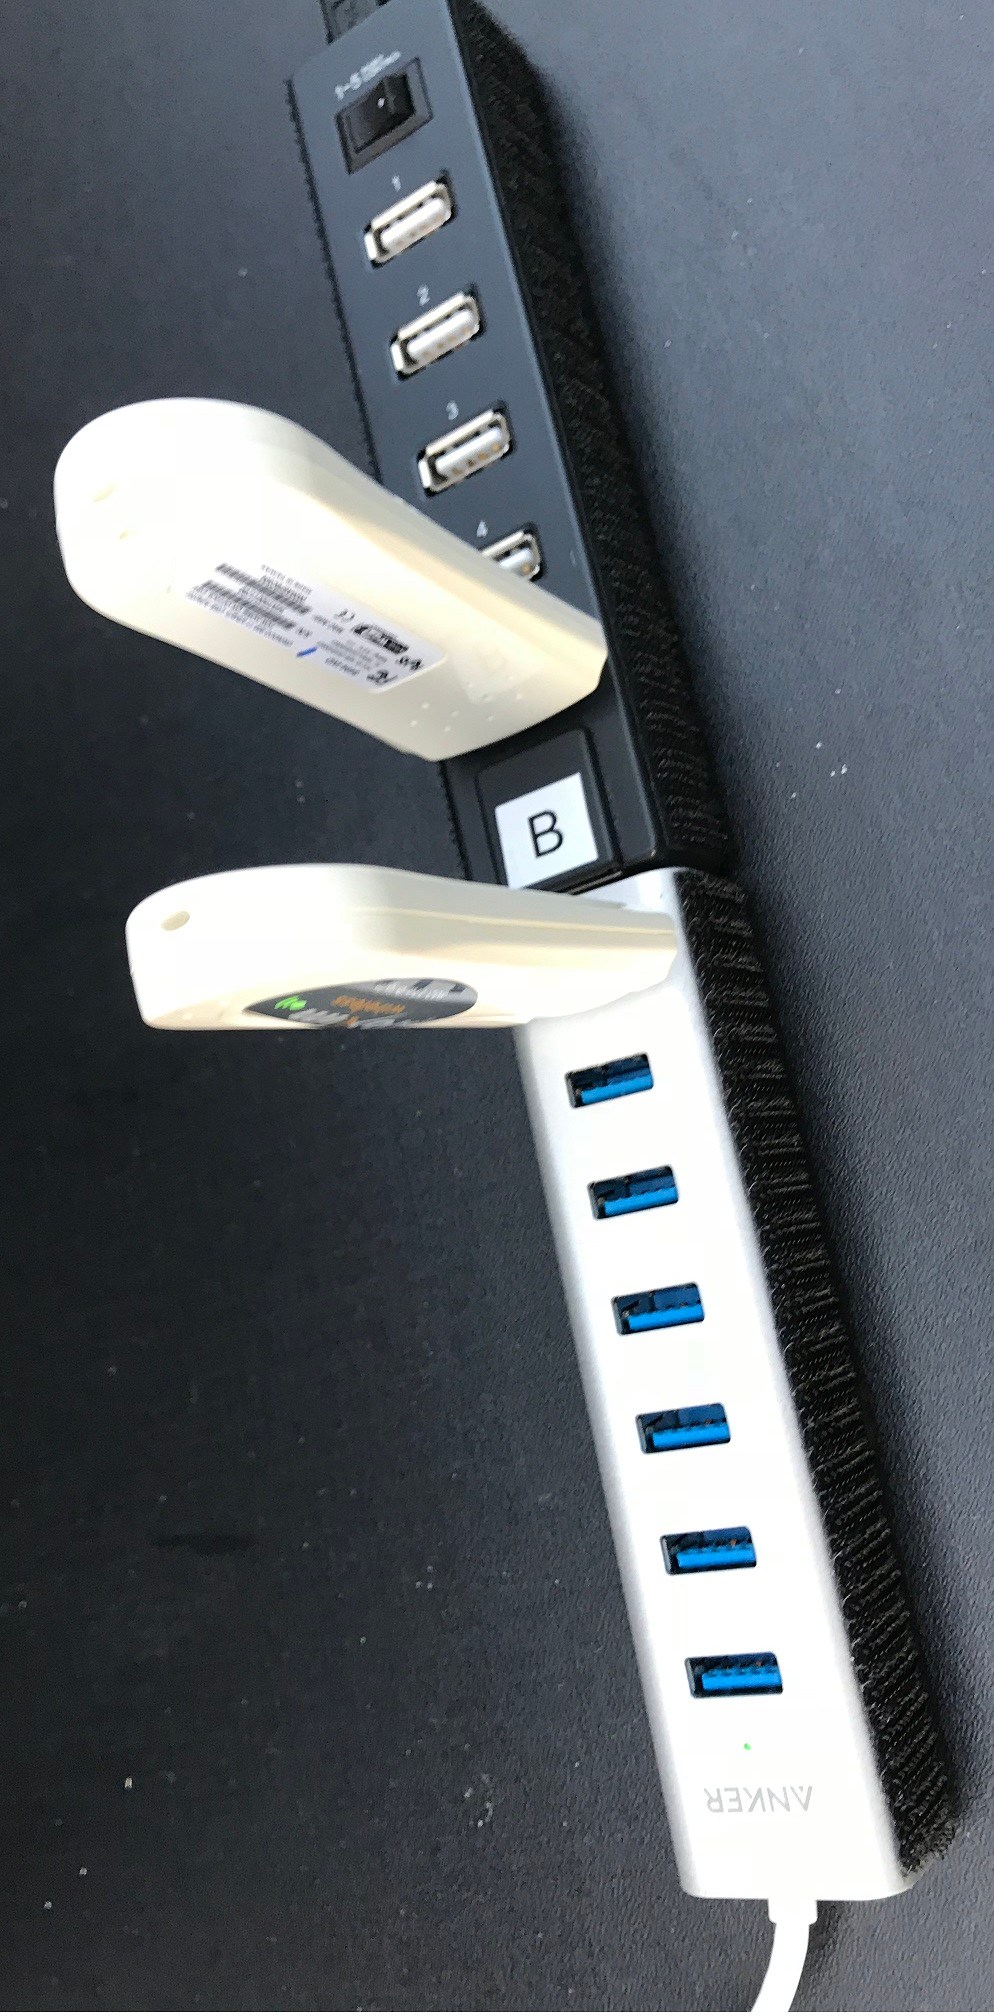
Three adapters, one Proxim, one Edimax and one Omnipeek were placed into each of the two hubs with more or less equal spacing. The two hubs were lined up end to end so that every single adapter had line-of-sight to the signal source. The AP was set to channel 6 because it had the least competing WLAN’s on it (1!) and because I wanted to see the effect on the 2.4GHz noise floor from the USB3.0 Anker hub.
I originally planned to simultaneously test the 6 adapters in the 2 different hubs so I could a) compare the real-time sensitivity of the adapters to each other and b) test the performance and noise of the new Anker hub against the long trusted Rosewill hub. I should have remembered that most survey software only supports capturing from 2-3 adapters at a time, and this goes for AirMagnet Survey Pro.
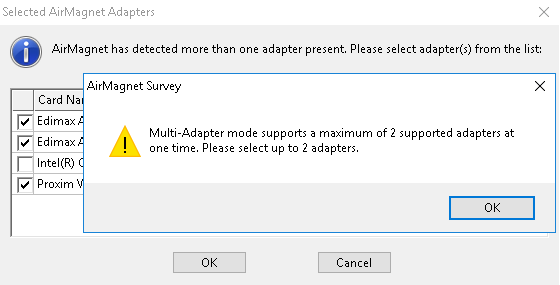
So I couldn’t test all the hubs and adapters at the same time. Instead I decided to leave the physical setup as it was but turn off/unplug one hub at a time. This would allow me to see a Proxim Vs Edimax with all other variables the same.
The only inconsistency I could see was that half the adapters were 180⁰ rotated to the other, due to the orientation of the hubs and the sockets within them. I hoped this wouldn’t result in a difference which invalidated the test and thankfully it appeared ok.
However, after the first test I realised there was a different physical side-effect I hadn’t expected. Keith Parsons mentioned it in his comparison of 15 Proxim adapters but I didn’t quite understand it at the time because, quite frankly, I couldn’t believe what I thought he was saying. Turns out, the exact location matters, even just centimetres apart changes the results. Plus, despite being in promiscuous (listening only) mode, the adapters actually had an effect on each other!
The CWNA had taught me about Refractions, Reflections and Scattering but I did not think I would see the effect of any of them at such close line-of-sight proximity to the signal source. However, the results were jumping around where it made an eyeball comparison all but impossible. So I devised a plan to freeze time!

So how do you stop time in 2017? You screenshot Survey Pro for reviewing later!
However, I wasn’t happy with a single measurement for each test because of how erratic the readings were being. What if I screenshotted at the peak or trough of a fluctuation? I needed to take more than one reading and find the trend.
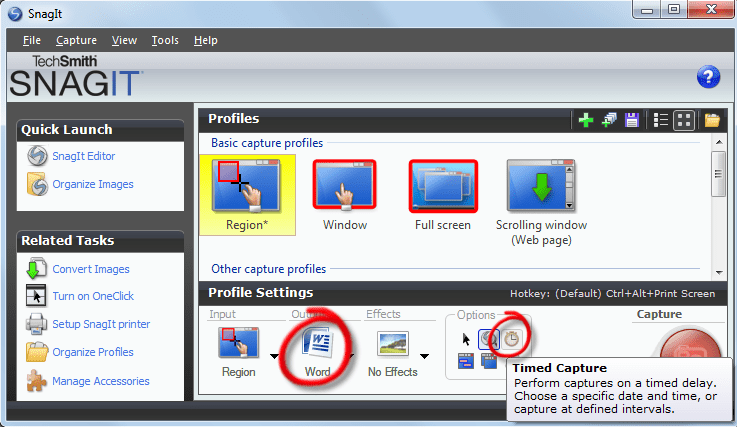
Well, it turns out SnagIt can screenshot on a timer and dump it to Microsoft Word. So I set SnagIt to take a screenshot every 3 seconds (to give it some breathing space) and I stopped it after 10 screenshots.
Having figured that part out, and with the October sun sinking and temperature dropping in the garden, I didn’t have much time. In an effort to capture all the data I would need for analysis later I hastily devised 7 tests.
I tested 3 of the adapters one at a time (Tests 3, 4 & 5) in exactly the same physical and hub position as Keith Parsons had advised. I was very careful not to move the USB hub when changing adapters but didn’t have the time to build a rig as Keith did.
I also tested one of each adapter type concurrently in each hub (Tests 1 & 2) to show the stability difference of the readings. Then I tested the Proxim’s head to head in each hub to measure the difference between the old and new hubs (Test 6).
Lastly I decided to test one of each adapter type alongside an Omnipeek protocol analysis adapter in the same hub to see how the latter compared. I don’t have photo evidence of this because it was dark and I was cold 🙂
In the interest of full disclosure the test setups are below. Excuse the unfortunate numbering setup, that was pure coincidence/bad luck!
1 – Anker / Proxim 3 in Slot 1 / Edimax 1 in Slot 3. Both hubs were plugged in but the Rosewill was turned off at its switch.
2 – Rosewill / Proxim 1 in Slot 3 / Edimax 3 in Slot 5. Anker hub was unplugged because AirMagnet would not launch using the Rosewill adapter otherwise.
3 – Anker / Proxim 3 in Slot 1. Rosewill switched off.
4 – Anker / Edimax 1 in Slot 1. Rosewill switched off.
5 – Anker / Proxim 1 in Slot 1. Rosewill switched off.
6 – Rosewill + Anker / Proxim 1 in Rosewill 5 / Proxim 3 in Anker 1
7 – Anker / Proxim 3 in Slot 1 / Edimax 3 in Slot 3 / Omnipeek 1 in Slot 5. Rosewill switched off.
The below table (click to enlarge) shows the results including the Average, but I decided the Average was not a reliable measurement because of the occasional extreme measurement, so I decided to calculate the Mode plus the Variance from the highest to lowest.
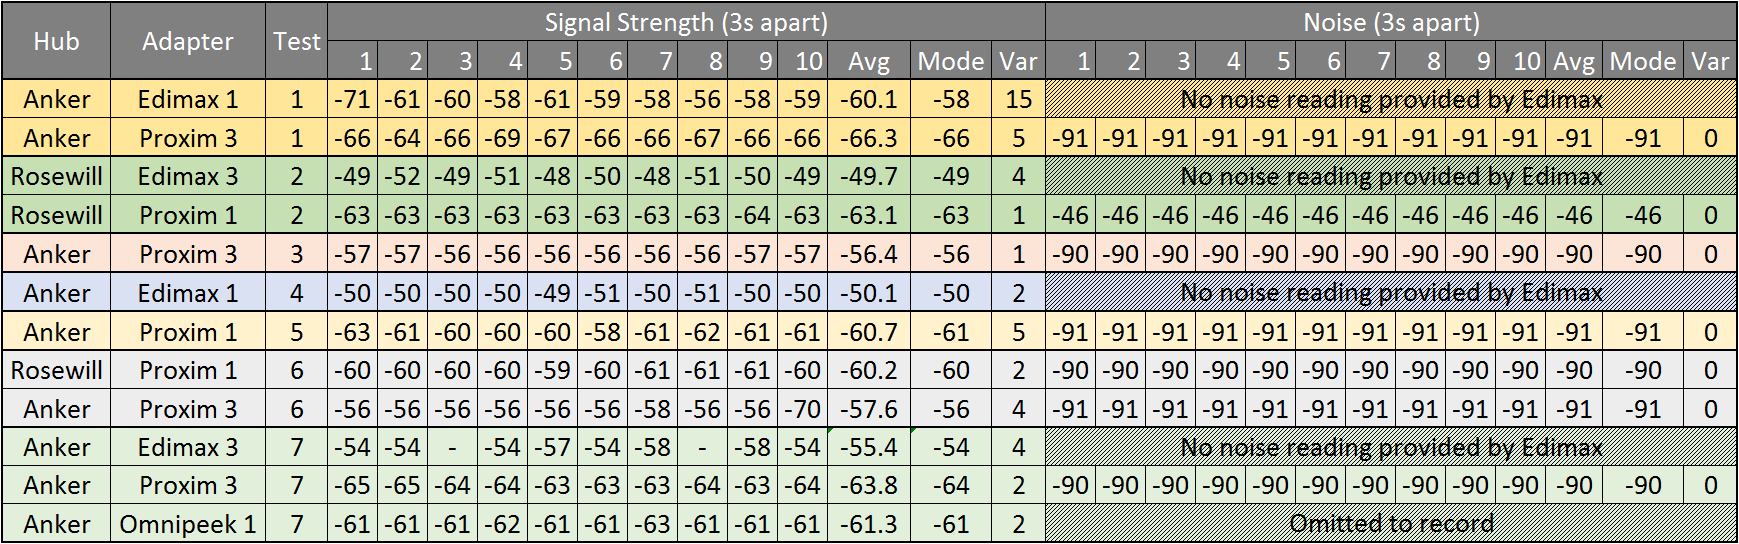
If we look at the results table we can see that in Test 1 and 2, three out of the four adapters had a pretty unstable receive sensitivity, ranging from 4dB Variance in measurements to a massive 15dB Variance. If we compare this to Tests 3 and 4, where I tested only one adapter at a time in exactly the same position on the same hub, the Variance in received signal strength is just 1 and 2 dB.
The data is somewhat inconsistent though as Test 5, also a single adapter in the same hub in the same position, shows a large Variance of 5dB, when in theory this should have been lower like Test 3 and 4. Plus Test 6 shows a low (and high) Variance when two hubs are used end to end (like Test 1 and 2).
So the data is insufficient to draw a firm conclusion but regardless, I think the advice is clear – when measuring your adapters you need to take the time to do it properly and test them one at a time in exactly the same hub and position.
Regarding the Anker hub, it is obvious to me that the hub is sufficiently built to avoid interfering with the 2.4GHz spectrum and I’m pleased to say it performed admirably in the field during a large frame capture.
Some last observations and notes:
- Unfortunately I was not clever enough to include the Noise column in my Omnipeek screenshots so I don’t have measurements for that.
- For an unknown reason the Proxim 1 adapter in Test 2 gave a completely false Noise reading. If it wasn’t for the 1dB fluctuation on Result 9 I would have assumed the adapter had frozen, but it appears it was receiving data during the test.
As always, if you have read this far, I would love to hear feedback both good and bad as it’s the only way we all move forward. Thank you.